Entropy is a measurement of the randomness of data. Highly repetitive data has a low entropy value close to 0, completely random data has an entropy of 1. Read more about the theory here.
RAID Reconstructor makes use of entropy values in order to find the RAID parameters. The Entropy test displays the entropy of the data of each sector.
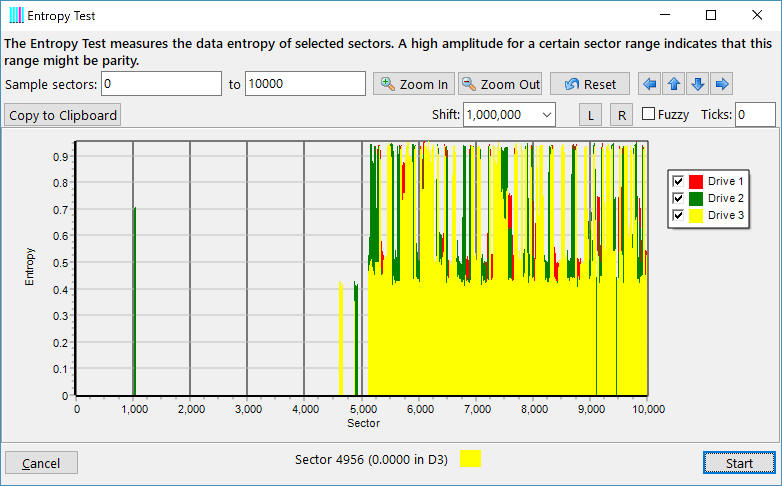
We load 3 RAID-5 drives in the main screen and click Tools->Entropy. Then we click on Start in the lower right corner.
The x-axis represents the sectors defined in "Sample sectors", 0-10,000. The y-axis represents the entropy of the data of a sector. The graphs for the 3 drives are drawn over each other in different colors. First drive drawn is Drive 1 (red), Drive 2 (green), Drive 3 (yellow). Move left (down) with the "L" button, right (up) with the "R" button. When pressing "L" or "R", the sector numbers shift by the value set in "Shift", 1,000,000. You can zoom in and out, or reset. As the last drawn drive, Drive 3 (yellow), overlaps the other drives, you can hide a drive by un-checking its checkbox to the right of the graph.
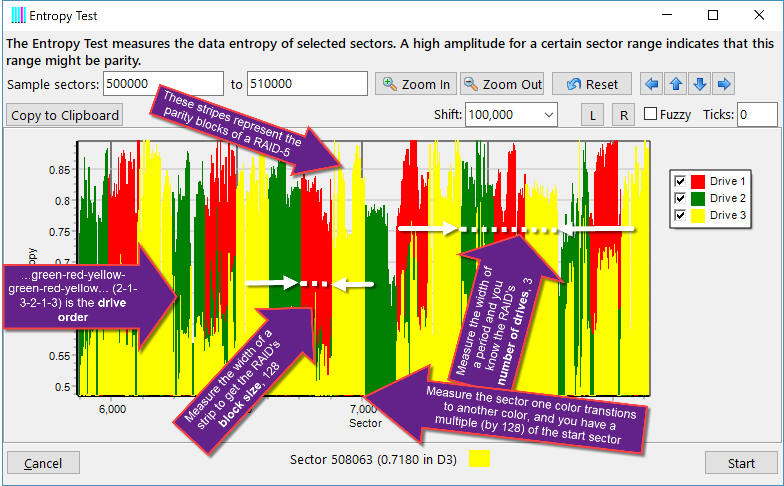
Let's move right to sector 500,000 to 510,000, and zoom in:
The stripes we see are the RAID members' parity blocks. Those have a higher entropy because the result of an XOR operation usually has a higher entropy than the underlying values.
Even if we know nothing about the RAID yet, we immediately can make lots of amazing measurements:
The ability to visualize the entropy of the RAID drives is a powerful tool. You do not only see the parity, you can also guess the kind of underlying data. High-entropy sectors often belong to compressed image files (JPG). Low entropy sectors often indicate empty or highly redundant data.
See also: